python利用geopandas库和pandas在anaconda的jupter notebook下生成疫情演变图


数据开源来源:https://github.com/lvwuwei/covid-france
演示图 https://www.chinanews.ga/4930.html
法国新冠病毒发展演变图 从2020年03月18日至2020年11月8日 考验你机器性能的时候到了,因为本图超过100m 请耐心等待加载……… &…

demo-covid.ipynb 利用这个生成演变图:目录下需要新建一个img文件夹
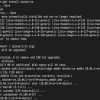
需要导入的依赖库
from IPython.display import HTML import requests import zipfile import io from datetime import timedelta, date import matplotlib import matplotlib.pyplot as plt from mpl_toolkits.axes_grid1 import make_axes_locatable import pandas as pd import geopandas as gpd import contextily as ctx from PIL import Image
源代码:
COVID-19 evolution in French departments
Visualize evolution of the number of people hospitalized in French departments due to COVID-19 infection
In [1]:
%load_ext lab_black%matplotlib inlineIn [2]:
from IPython.display import HTMLimport requestsimport zipfileimport iofrom datetime import timedelta, dateimport matplotlibimport matplotlib.pyplot as pltfrom mpl_toolkits.axes_grid1 import make_axes_locatableimport pandas as pdimport geopandas as gpdimport contextily as ctxfrom PIL import ImageCOVID data are open data from the French open data portal data.gouv.fr: https://www.data.gouv.fr/fr/datasets/donnees-relatives-a-lepidemie-du-covid-19/
In [3]:
url_dep = "http://osm13.openstreetmap.fr/~cquest/openfla/export/departements-20140306-5m-shp.zip"covid_url = ( "https://www.data.gouv.fr/fr/datasets/r/63352e38-d353-4b54-bfd1-f1b3ee1cabd7")filter_dep = ["971", "972", "973", "974", "976"] # only metropolitan Francefigsize = (15, 15)tile_zoom = 7frame_duration = 500 # in msLoad French departements data into a GeoPandas GeoSeries
More information on these geographical open data can be found here: https://www.data.gouv.fr/fr/datasets/contours-des-departements-francais-issus-d-openstreetmap/
In [4]:
local_path = "tmp/"r = requests.get(url_dep)z = zipfile.ZipFile(io.BytesIO(r.content))z.extractall(path=local_path)filenames = [ y for y in sorted(z.namelist()) for ending in ["dbf", "prj", "shp", "shx"] if y.endswith(ending)]dbf, prj, shp, shx = [filename for filename in filenames]fr = gpd.read_file(local_path + shp) # + encoding="utf-8" if neededfr.crs = "epsg:4326" # {'init': 'epsg:4326'}met = fr.query("code_insee not in @filter_dep")met.set_index("code_insee", inplace=True)met = met["geometry"]Load the map tile with contextily
In [5]:
w, s, e, n = met.total_boundsbck, ext = ctx.bounds2img(w, s, e, n, zoom=tile_zoom, ll=True)Plot function to save image at a given date (title)
In [6]:
def save_img(df, title, img_name, vmin, vmax): gdf = gpd.GeoDataFrame(df, crs={"init": "epsg:4326"}) gdf_3857 = gdf.to_crs(epsg=3857) # web mercator f, ax = plt.subplots(figsize=figsize) ax.imshow( bck, extent=ext, interpolation="sinc", aspect="equal" ) # load background map divider = make_axes_locatable(ax) cax = divider.append_axes( "right", size="5%", pad=0.1 ) # GeoPandas trick to adjust the legend bar gdf_3857.plot( column="hosp", # Number of people currently hospitalized ax=ax, cax=cax, alpha=0.75, edgecolor="k", legend=True, cmap=matplotlib.cm.get_cmap("magma_r"), vmin=vmin, vmax=vmax, ) ax.set_axis_off() ax.get_xaxis().set_visible(False) ax.get_yaxis().set_visible(False) ax.set_title(title, fontsize=25) plt.savefig(img_name, bbox_inches="tight") # pad_inches=-0.1 to remove border plt.close(f)Load COVID data into a pandas DataFrame
In [7]:
cov = pd.read_csv(covid_url, sep=";", index_col=2, parse_dates=True,)cov = cov.query("sexe == 0") # sum of male/femalecov = cov.query("dep not in @filter_dep")cov.dropna(inplace=True)cov.head()Out[7]:
Add geometry data to COVID DataFrame
In [8]:
cov["geometry"] = cov["dep"].map(met)Parse recorded days and save one image for each day
In [9]:
def daterange(date1, date2): for n in range(int((date2 - date1).days) + 1): yield date1 + timedelta(n)Create the folder img at the root of the notebook
In [10]:
vmax = cov.hosp.max()for i, dt in enumerate(daterange(cov.index.min(), cov.index.max())): title = dt.strftime("%d-%b-%Y") df = cov.query("jour == @dt") df = df.drop_duplicates(subset=["dep"], keep="first") img_name = "img/" + str(i) + ".png" save_img(df, title, img_name, 0, vmax)Compile images in animated gif
In [11]:
frames = []for i, dt in enumerate(daterange(cov.index.min(), cov.index.max())): name = "img/" + str(i) + ".png" frames.append(Image.open(name))frames[0].save( "covid.gif", format="GIF", append_images=frames[1:], save_all=True, duration=frame_duration, loop=0,)from IPython.display import HTMLHTML("<img src='covid.gif'>")